Why I built a fiber link health monitor
Turning OTDR exports into a pass/fail dashboard with Python, Flask, SQLite, and React.
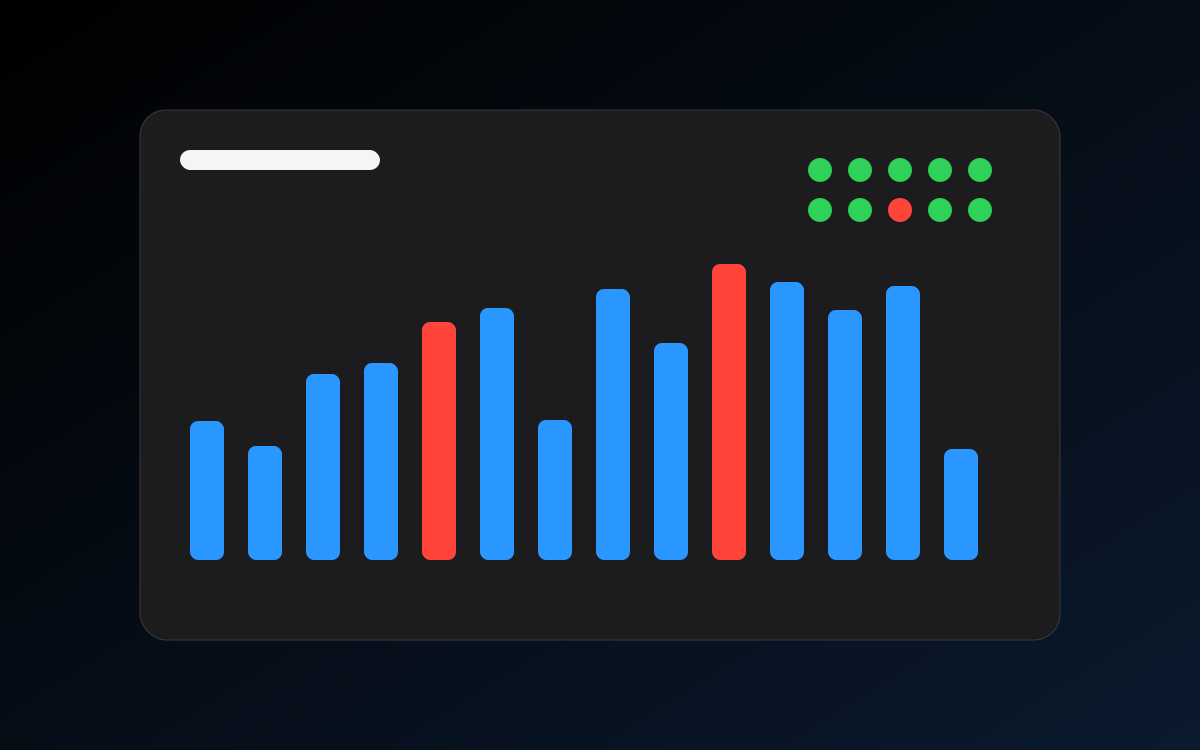
During cluster turn-up, a lot of test data gets generated and a lot of it sits in exported files. I wanted a faster way to see which links were failing, and where loss was trending the wrong way, at the rack and site level.
What it does
The Fiber Link Health Monitor is a small pipeline that:
- Ingests OTDR exports
- Classifies each link as pass or fail against loss thresholds
- Flags failing links and loss trends on a dashboard
The stack
- Python for parsing and classification
- SQLite for storing results
- Flask for the API
- React.js for the dashboard
Why it matters
In high-density builds, the question is rarely “did we test it?” It’s “which of these hundreds of links needs attention right now?” A dashboard that answers that at a glance saves time during turn-up.
I’ll write a deeper walkthrough of how it works in a future post.